- Solar advice hub
- Cities-and-regions
- How many homes have solar panels in the UK?
How many homes have solar panels in the UK?
Here's how many homes have solar panels in the UK, which areas have the most, and how the UK compares with Europe.


Why you can trust our content
We know that the solar industry is full of misinformation, but we only use reliable sources, including:
- Our experienced solar experts, installers and system designers
- Our own database of solar & battery system designs
- Authoritative bodies like MCS and the UK government


Calculate savings
What kind of home do you live in?
Calculate savings
What kind of home do you live in?
At a glance
Before you get solar panels, it’s wise to find out how widespread and popular the technology is – and whether your region of the country has jumped on board.
In this guide, we’ll run through how many homes have solar panels, which areas have the most and fewest solar installations, and how the UK compares with Europe in the solar stakes.
If you would like to see the savings you could get from a solar & battery system, answer a few quick questions and we’ll provide an estimate.
Find out how much you can save
What kind of home do you live in?
How many UK households have solar panels?
1.6 million households in the UK have solar panels, according to the latest government data.
That means 5.8% of the UK’s 29 million households have gone solar.
As recently as December 2020, fewer than a million UK homes had solar panels – which shows how far we've come in relatively little time.


How has this increased over time?
The first household to get solar panels in the UK was the Oxford Ecohome, which made the leap in 1995, but take-up over the next 15 years was glacial.
The government started recording installation numbers in 2010, when just 4,454 households had gone solar – but the subsequent years have seen an explosion in solar demand across the UK.
Check out the chart below to see how the number of homes in the UK with solar panels has changed over time.
Cumulative number of households with solar panels, UK 2010-2026
The spike in solar installations in the first half of the 2010s was largely prompted by the government’s Feed-in Tariff scheme, launched in 2010, which paid solar owners for all the electricity they generated and exported.
As the government put steadily less funding towards this initiative from 2016 onwards, installation numbers fell – but they’ve climbed rapidly since the start of the Smart Export Guarantee in 2020, and particularly after the energy crisis hit in 2021.
There have been more than 600,000 solar panel installations since the start of 2022, which has grown the proportion of UK households with solar panels from 3.5% to 5.8%.
Considering just 203,036 solar panel systems were installed from the start of 2016 to the end of 2021, this represents a massive uplift.
For a clearer picture, here's the number of residential solar PV installations per year since 2010.
Number of residential solar PV installations per year, 2010-2026
How does UK solar uptake compare to other countries?
The UK's solar uptake is pretty good, but dramatically behind the dizzying achievements of Australia and The Netherlands.
Australia is naturally blessed with superb levels of sunshine, and there are now more than one in three homes in Oz with rooftop solar after a generous series of government subsidies and export tariffs bore fruit.
And given the comparative lack of sunshine in The Netherlands, the Dutch are doing extremely well. With almost a third of homes already using solar energy, the Dutch government aims to make 70% of its electricity renewable by 2030, primarily through expanding solar and wind power.
They’ve incentivised residential solar uptake with schemes such as the Investment Subsidy for Sustainable Energy (ISDE), which covers part of the cost, and a net metering scheme (salderingsregeling) that allows homeowners to offset the energy they feed back into the grid with the energy they use each year.
But the UK's place below some of its international peers isn't down to a lack of enthusiasm.
The recent uptick in the number of households going solar is enough evidence to prove this, along with the fact that 68% of homeowners want to get solar panels, according to the latest government data.
Unfortunately, the high upfront cost of solar panels stops many people from turning this wish into reality, especially as the great majority don't qualify for any solar grants.
Solar uptake in other countries
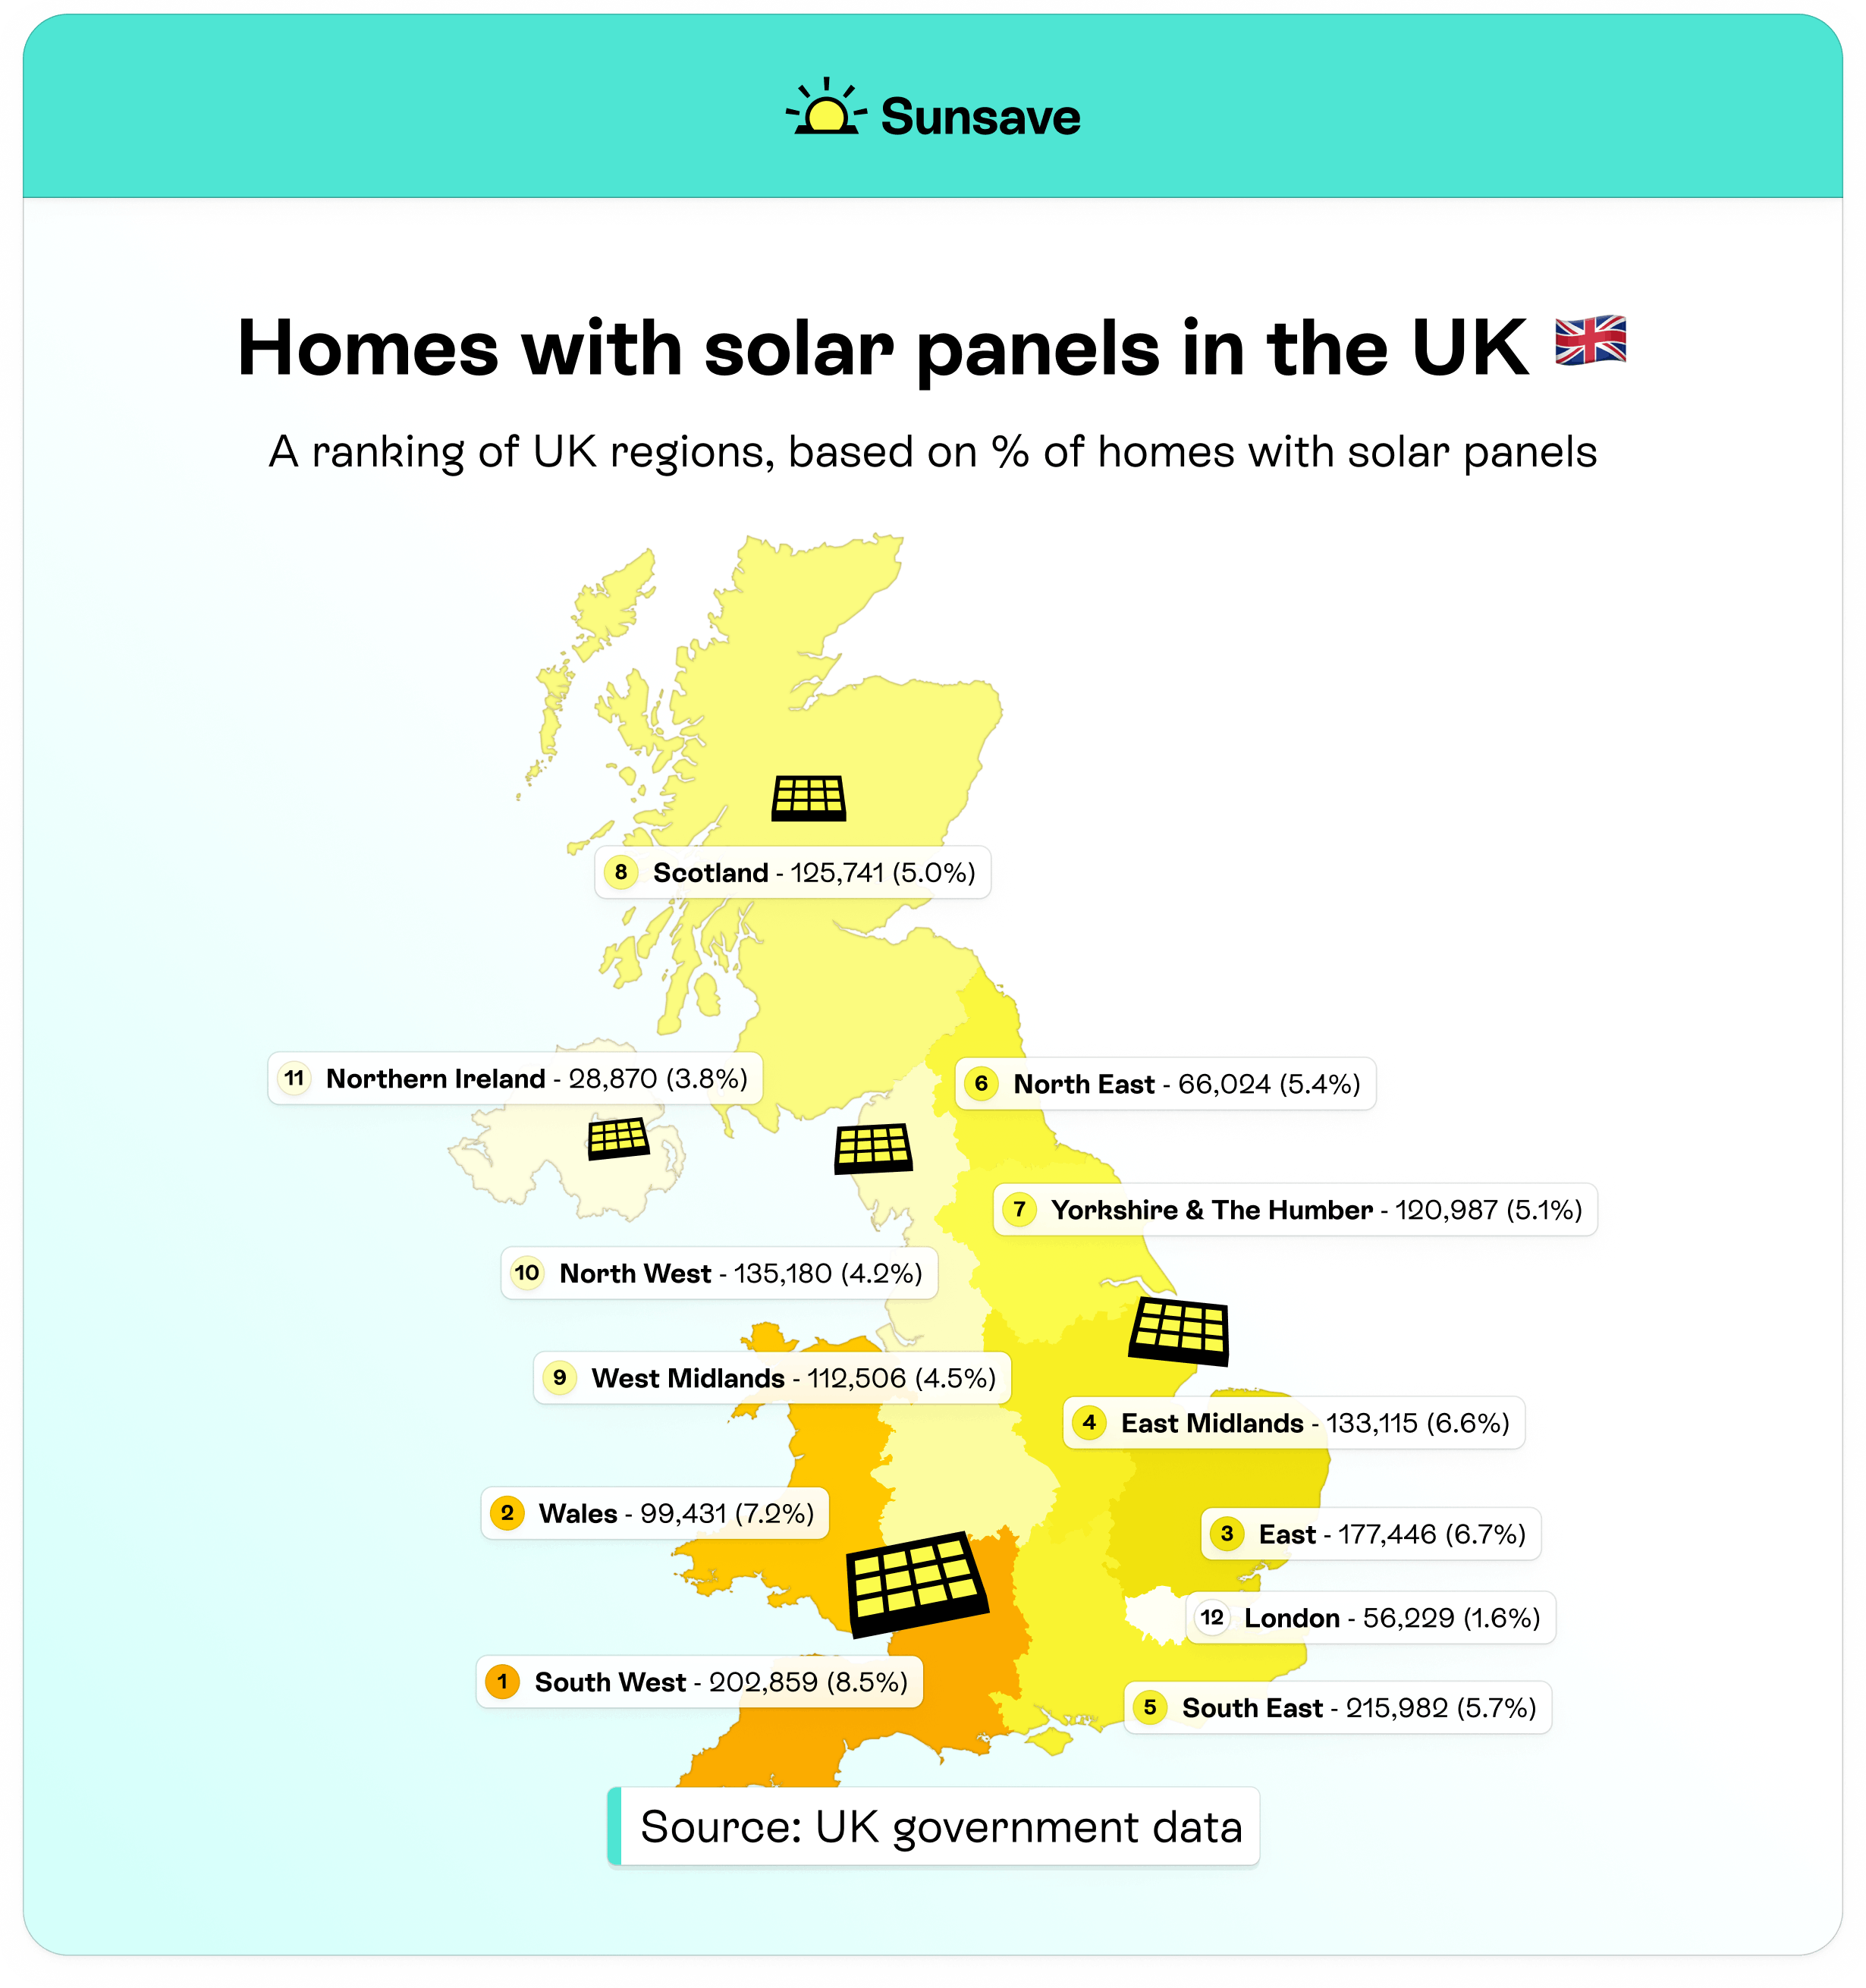
Which parts of the UK have the most installations?
South West England has the highest percentage of homes with solar panels, as you can see in the map below.
8.5% of households in the South West have gone solar, which puts the region well ahead of its closest competitors. Wales is second with 7.2%, just ahead of the East of England on 6.7%.
Wales is also the most enthusiastic about solar of the four UK nations, ahead of England on 5.2%, Scotland on 5%, and Northern Ireland on 3.8%.
There are savings to be gained beyond the south and central regions of the UK, as shown by the fact that 5.4% of homes in North East England have solar panels – which is slightly above the national average.
Which type of property is most likely to have solar?
The most likely type of property to have a solar installation is an owner-occupied household, as these properties make up 70.6% of solar owners - based on MCS data.
On the flip side, only 12.8% of homes with solar panels are privately rented.
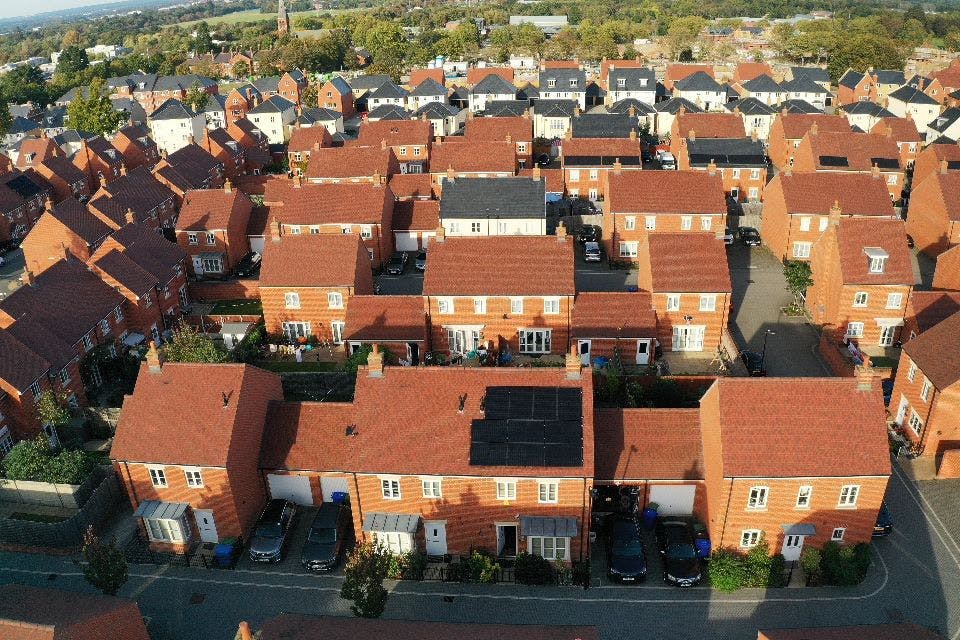
In terms of building type, 36% of solar panel systems are on detached homes, just ahead of semi-detached properties, on 31.4%.
Terraced houses own 19.9% of solar installations, ahead of flats, which once again lag behind on 12%.
Summary
The areas of the UK with the highest solar adoption rates are broadly also the best places for solar panels – and that’s no coincidence.
On average, households in Wales and the south of England can save more money with solar panels than other regions of the country, which makes the prospect more attractive.
However, solar panels can still save you hundreds of pounds per year if you live in other parts of the UK, and the recent record-breaking run of installations all over the nation seems to show that households know it.
If you’re wondering how much a solar & battery system could save you, just answer a few quick questions and we’ll provide you with an estimate.
Find out how much you can save
What kind of home do you live in?
UK homes with solar: FAQs

Related articles

Written byJosh Jackman
Josh has written about the rapid rise of home solar for the past seven years. His data-driven work has been featured in United Nations and World Health Organisation documents, as well as publications including The Eco Experts, Financial Times, The Independent, The Telegraph, The Times, and The Sun. Josh has also been interviewed as a renewables expert on BBC One’s Rip-Off Britain, ITV1’s Tonight show, and BBC Radio 4 and 5.